KEEP TRACK OF PEAK 2019
Each year Metapack produces benchmarking reports to help the industry understand how peak deliveries are shaping up. The Peak Profile Index and Carrier Performance Heat Map are updated weekly to help you keep track of Christmas peak.The Peak Profile
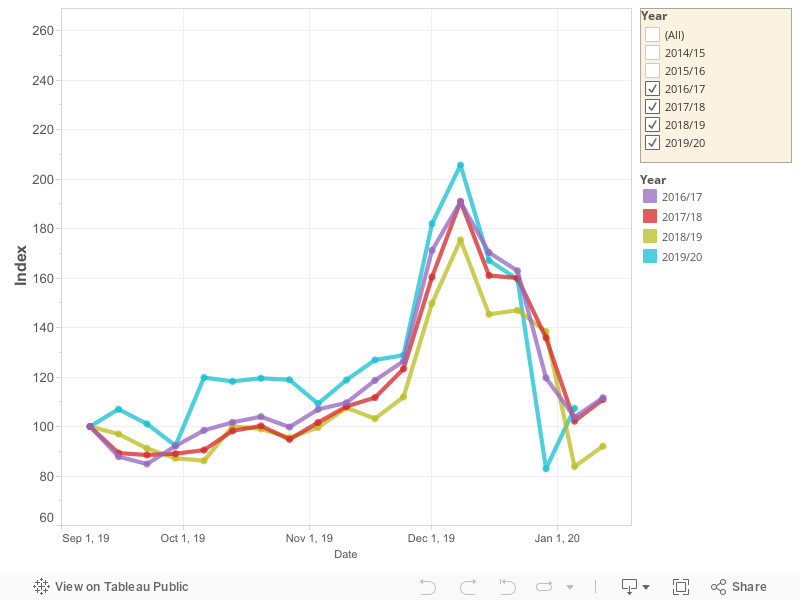
The Peak Profile Index is a visual representation of how a sample set of our eCommerce customers (retailers and brands) perform over the Peak period. Metapack defines peak as 1st November through to 15th January (22nd January for returns). We index all volumes from the beginning of September to show their relative growth during peak which allows for year on year industry comparisons.
For weekly commentary on the Peak trading period, jump over to our blog.
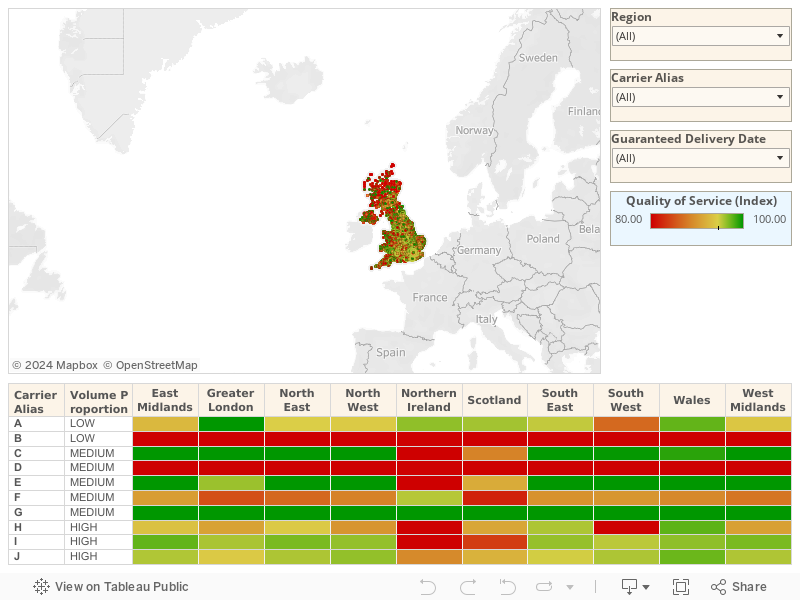
Carrier Heat Map
The Carrier Performance Heat Map allows you to track how the top UK carriers perform throughout the Peak period. Carrier performance figures from September were calculated for each carrier, using a sample set of our customers. We index all figures to allow you to see each carrier’s improvement/degradation in service, relative to their performance in September. The dashboard below is interactive, so feel free to use the filters or click on the table and map to see a little more detail.